How to be a Successful Forex Trader?
Would you like to have the best of both worlds?
Read on!
What drives forex markets?
To put it simply the fate of a forex pair is determined by the supply and demand of the currencies in the pair.
The demand depends on a lot of factors, but there are two that are the most important. The first is the performance of the economy behind the currency, the US economy for the Dollar as an example—the better the economy, the higher the demand for the currency. The second is the interest rate set by the central bank of the given country—the higher the interest rate, the higher the demand.
The supply is simple; in today’s world central banks decide the available amount of currencies. And as with everything the more there is of something the less valuable it is. So when you here that a country is printing more money you can be sure they want their currency to be cheaper.
If you pay attention to news and trends, you might be able to forecast the primary direction of currency trends.
But there is another huge factor that I haven’t mentioned the psychology of traders and the effect that has on prices. That’s where technical analysis comes in!
Technical Analysis
Technical analysis (TA) is the study of the price history of any financial market and the prediction of prices based on that. The theory behind TA is that people in crowds tend to react similarly in situations that are alike and that prices move in trends.
In practice, that means that following a particular type of price movements (chart pattern) the following movements will also be similar.
Trends mean that there are long-term movements in prices based upon changes in the factors behind supply and demand.
For you, the only thing to remember is to look for trends and reliable chart patterns and use them in your trading!
Trend Basics and Examples of Chart Patterns
To get you started, let’s look at some examples of both chart patterns and trend measures. There are lots of methods to analyze prices, but all of them are based on some tables that represent the price history of a forex pair.
Charting is the process of identifying (and drawing) trends, patterns and using various indicators to analyze the behavior of the given market.
Moving Averages
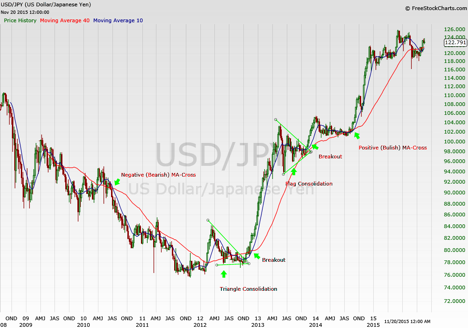
Probably the best-known indicators are Moving Averages that capture both short and long-term trends in a price. Looking at the example weekly chart of the USD/JPY (Dollar/ Japanese Yen), there are two (the ‘quick’ average: 50-week MA and the ‘slow’ average: 200-week MA, blue and red lines respectively) moving averages on it.
One way to look at these averages is that if they are rising that signals an up-trending market and you should be buying the pair (the quick average is used to for the short term while the slow for the long-term) and if they are declining you should sell the pair.
The second, and more advanced, way is to analyze the alignment of the two averages. A buy signal (called Bullish signal) is given when the quick average crosses above the slow one and conversely a sell (or Bearish) signal is when it crosses below it. There are annotated examples for both of these signals for better understanding.

Breakouts and consolidations
Trading breakouts from consolidation patterns are one of the most reliable trading strategies. A consolidation pattern is usually found after a strong move when the market ‘digests’ the move and gets ready for the next trend.
There are numerous patterns like this, and they are named after something they resemble.


Share the post "How to be a Successful Forex Trader?"