Technical Analysis as an Investment Tool
Financial Forecasting
Hyungsub Moon, Staff Writer
For centuries, fortunetellers have comforted people with a glimpse of their futures. With their crystal globe or taro cards, fortunetellers often spoke about the future with believed certainty. In a modern world of finance, technical and fundamental analysts are somewhat like fortunetellers, sans the crystal globe or taro cards. Instead, they march with their bar graphs and primary data and tell you what the future should look like.
Technical analysis is often contrasted with fundamental analysis. Fundamental analysis studies various macroeconomic, industry and firm-specific factors that influence prices. Technical analysis, on the other hand, solely looks at the past and present prices to predict the future.
Many academic curriculums in business schools often exclusively focus on fundamental analysis as it holistically integrates various crucial facets of business education. Understanding various factors influencing a business or economy as a whole can give executives and government officials great strategic advantage and general policy directions. Therefore, fundamental analysis is crucial because it tells you which factors matter.
However, fundamental analysis often heavily focuses on theories and how the economy should be in the long-term, ignoring how it is and how it will be in the short-term. Economic bubbles are great examples of how fundamental analysis often fails to account the short-term price levels.
Technical analysis exclusively studies past and present prices or rates. Since the economy often does not work in the way it should, technical analysis can provide great insights on economic bubbles, investors’ expectations, market momentums and a market psychology. Thus, doing technical analysis on factors that matter from fundamental analysis could provide better short-term future insights on macroeconomic conditions than doing fundamental analysis alone.
Last December, Mr. David Prince, the president of Harbinger Capital Markets, came to York University for an NFSA sponsored lecture to discuss why technical analysis is a useful investment tool. Let’s go through a few economic indicators he outlined in the presentation.
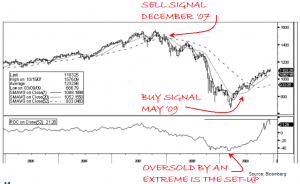
Studying stock index with moving averages and volume analysis can provide some insights on whether you should buy or sell specific stocks. If you look at a general index such as S&P 500 as illustrated in graph 1, it can also tell you whether you should be investing in stock market in general or not in the short-term.
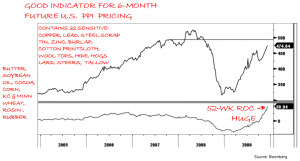
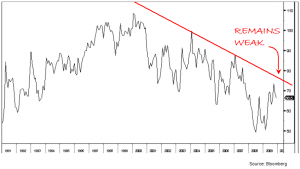
Studying commodity indexes such as the Spot Raw Industrial Index (graph 2)
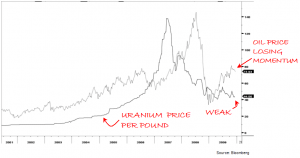
and the Uranium and WTI Crude Oil Continuation Series (graph 3)
can provide some insights on how commodity-intensive companies’ earnings will be affected in the near future due to the changes in terms of the supply side.
Many investors consider rises in gold prices to be an indication of economic and political instability. Inversion of yield curves is also a great leading indicator for economic instability as it indicates that investors are locking in short-term rates in pessimistic future expectations.
Treasury bill rates are also great indicators of how economic and monetary policies of governments around the world will be in the near future. When the economy goes into a recession, it is very common for governments to lower interest rates to stimulate the economy as evidenced by the recent global recession. If stock markets rebound yet the government still plans to hold the low rates, it can send signals to investors that recovery is perhaps unstable and that the market is overly optimistic.
Other sources of useful information that may provide great insights on short-term macroeconomic conditions are currency indexes. These can help investors learn the coming trends in import and export dependant industries, which in turn, may help one predict (to an extent) a nation’s economic health and the level of government interference within it.
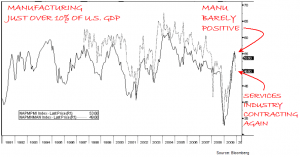
As well, manufacturing indices (such as the US ISM Manufacturing & Non-Manufacturing Indices, graph 4) indicate the health of manufacturing industries, which (indirectly) may shed light on the future health commodities suppliers.
Consumer confidence indexes (graph 5) meanwhile, can shed light upon the future (short term) prospects of the retail industry in particular, which (like a ripple effect) may shed light upon the future prospects of retail suppliers.
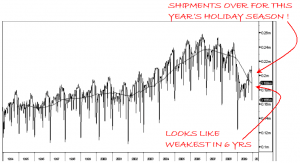
Similarly, even indexes of railroad carloads and shipping can provide a clue as to the health of certain sectors, as graphs 6 (Amer. Assoc. of Railroads Intermodal Carloads – Weekly),
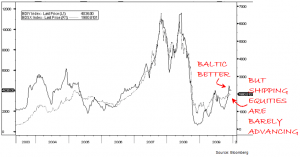
and Graph 7 (Baltic Dry Index & Bloomberg Dry Ship Index – Weekly) show that in the lead up to the 2009 holiday season, shipments were the lowest in six years, indicating that retailers were predicting weaker sales and accordingly, buying less to stock their shelves.
In all, fundamental and technical analyses have pros and cons. Depending on forecasting horizons, one can be more beneficial than the other. But winning in the markets depends on understanding risk and adding a healthy understanding of technical analysis will help you learn what you want and can expect, to help you determine the most successful investment strategy for your needs.
All graphs were sourced from a presentation provided by David Prince of Harbinger Capital Markets
Arbitrage Magazine
Liked this post? Why not buy the ARB team a beer? Just click an ad or donate below (thank you!)




Share the post "Technical Analysis as an Investment Tool"